
Setting Up and Using BloodHound for Active Directory Security
BloodHound is a powerful tool for identifying and mapping attack paths within Active Directory environments.

Guide to Installing and Playing with BloodHound
BloodHound is a powerful tool for identifying and mapping attack paths within Active Directory environments. It helps security professionals understand potential escalation paths that an attacker could exploit to gain privileged access in a network. This guide will walk you through the process of installing and using BloodHound for Active Directory enumeration, as well as how to collect data using SharpHound and BloodHound Python.
1. Update and Upgrade Your System
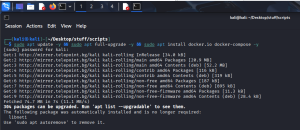
Before installing any tools, it’s always a good idea to ensure that your system is up to date. Run the following commands to update and upgrade your system:
sudo apt update -y && sudo apt full-upgrade -y
This ensures that your system has the latest security patches and updates.
2. Install Docker
BloodHound can be easily set up using Docker, which simplifies the installation and running of the tool in an isolated environment. To install Docker, use the following command:
sudo apt install docker.io docker-compose
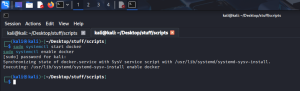
After installation, start and enable the Docker service to ensure it runs after a reboot:
sudo systemctl start docker
sudo systemctl enable docker
3. Download and Install BloodHound
Once Docker is set up, create a directory and download the latest release of BloodHound CLI:
mkdir bloodhound && wget https://github.com/SpecterOps/bloodhound-cli/releases/latest/download/bloodhound-cli-linux-amd64.tar.gz
tar -xzf ./bloodhound-cli-linux-amd64.tar.gz
rm bloodhound-cli-linux-amd64.tar.gz
This will extract the BloodHound CLI and remove the tarball to keep things tidy.
4. Install and Run BloodHound
Now, you’re ready to install BloodHound using Docker. Simply run:
sudo ./bloodhound-cli install
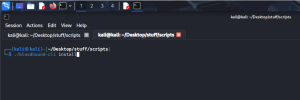
This will spin up the BloodHound container, and you can access the web interface via http://localhost:8080.
5. Web Interface Access
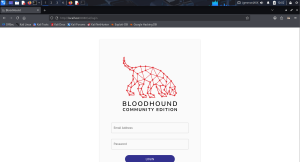
To interact with BloodHound through the web interface, open your browser and go to:
The default credentials for logging into the interface are:
username: admin
password: check the console
6. Data Collection with SharpHound
BloodHound relies on SharpHound for data collection, which is responsible for gathering information about the Active Directory environment. On your Windows machine, you can run SharpHound with the following command to collect data:
.\SharpHound.exe -d windomain.local -c All --Stealth --OutputDirectory C:\temp\ -v
This command performs a full enumeration (-c All), making it stealthy and saving the output to C:\temp\.
7. Remote Data Collection with BloodHound Python
You can also collect data remotely using BloodHound Python. Here’s how to collect data from a remote Kali machine:
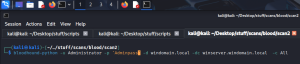
bloodhound-python -u Administrator -p 'AdministratorPass' -d windomain.local -dc winserver.windomain.local -c All
This command uses your provided username and password to collect data about the Active Directory from a remote server (winserver.windomain.local).
8. Uploading Data Collection via the BloodHound UI (Administration)
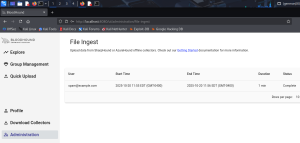
After collecting data with SharpHound or bloodhound-python, the next step is importing that data into the BloodHound web UI for visualization and analysis. Here’s how to upload the data and what to expect:
Accepted formats
SharpHound produces
.ziparchives (recommended) or individual.jsonfiles. BloodHound accepts both;.zipis the easiest for multi-file uploads.
Steps to upload:
Navigate to the Administration section in the top navigation bar.
Select Upload Data (this may also appear as Ingest or Import depending on the UI version).
Either:
Drag-and-drop the SharpHound
.zipfile into the upload area, orClick Choose File and select the
.zip/.jsonfile(s).
Click Upload (or Ingest). The UI will display the progress and provide success or failure feedback upon completion.
Once uploaded, navigate to the Queries or Database view and refresh (or re-log in) to view the newly ingested nodes/edges and start your analysis.
What you’ll see after upload:
Uploaded nodes (users, computers, groups, trusts) will appear in the graph and database.
New collection timestamps and source metadata will be shown in the dataset list.
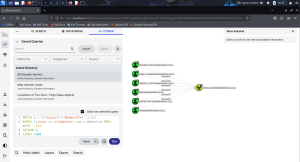
You can immediately run pre-built queries (e.g., “Shortest Paths to High Value Targets,” “Find Domain Admins,” “Kerberoastable Accounts”).
- All Active Directory domain Admins
Recommended Immediate Actions:
Run the “All Paths to Domain Admins” query or equivalent high-value queries to prioritize risk quickly.
Use filters to focus on high‑privilege or recent findings (e.g., accounts with delegated rights or unconstrained delegation).
Export critical findings (CSV/graph) for your reports or remediation tracking.